LED Matrix Shield

LED Matrix Shield, with row and bit ordering annotated
The LED Matrix Shield is a D1 Mini form factor shield, featuring an 8x8 LED Matrix of red LEDs.
The shield has a TM1640 LED matrix driver on it that means we don’t need to worry about how to make the matrix turn each LED on, we just send it a command with the LEDs we want enabled and it makes it happen!
Further to this, there’s a MicroPython TM1640 driver that has already been
developed, and so we can use this to easily control the matrix in MicroPython.
This tmp1640.py file from this should already be loaded onto your TTGO
board, so you should be set to get started!
Plugging in
Warning
While it is possible to plug shields in to the device while it is powered (plugged in to your computer), it is not recommended! As such, please remember to unplug the USB from your board prior to connecting or disconnecting any shields, or else you risk damaging the shield or the board.
In order to start working with the LED matrix, we’ll need to connect the shield to your TTGO board. If there is already a shield connected to your board (such as the RGB LED shield from the previous section), then first remove this. Then plug the LED Matrix shield into the board - the “LOLIN” label should be over the USB port of the main board. Then simply align the 8 pins on either side with the sockets on the main board and push them together!
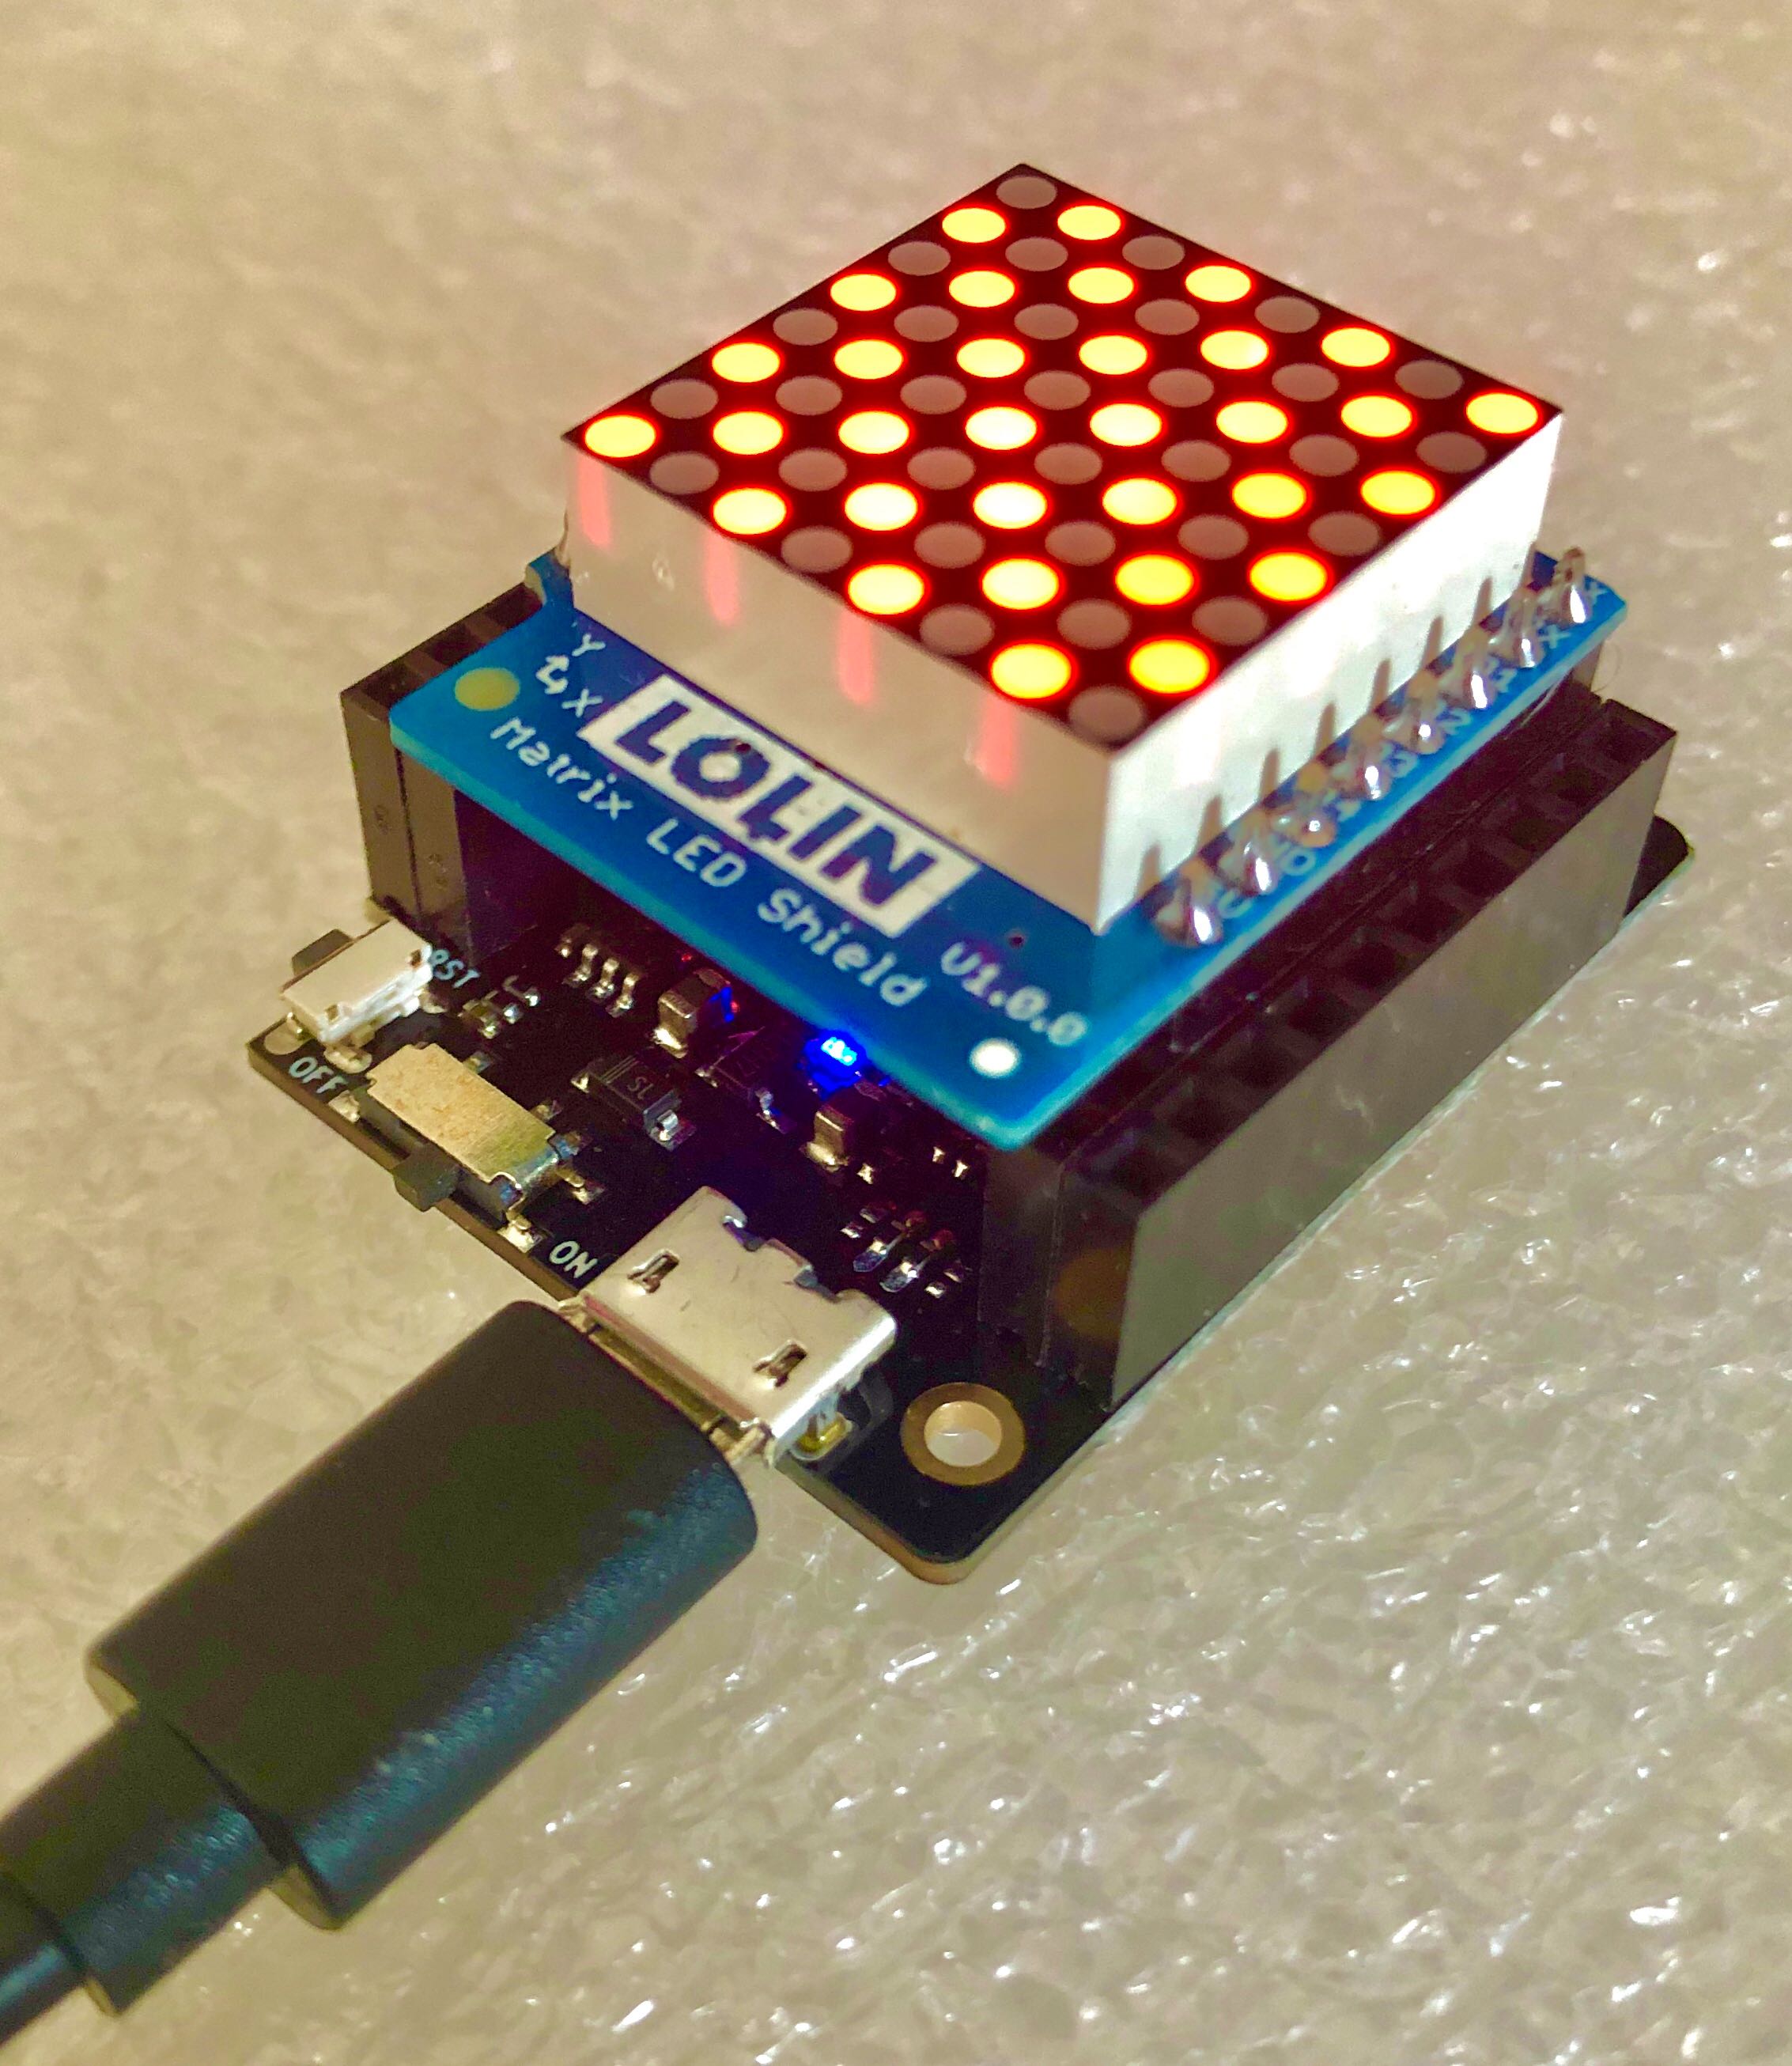
Note the LOLIN text over the USB connection
Enter the Matrix
Now we’ve got the shield on the board, connect to the board with your USB again, and get into the REPL (by connecting to your device in your serial terminal software of choice). Now let’s run the following commands to get these LEDs lit:
1 2 3 4 5 | import machine
import d1_mini
import tm1640
tm = tm1640.TM1640(clk=machine.Pin(d1_mini.D5), dio=machine.Pin(d1_mini.D7))
tm.write([255,255,255,255,255,255,255,255]) # 255 = 0b11111111
|
Now all LEDs on the LED Matrix should be illuminated! Now lets run through what we just did:
- Imported the MicroPython
machinemodule – we need this to configure our pins before passing them to ourtm1640driver - Imported our
d1_minimodule – we need this to get the pin information to then configure the correct pins for communicating with the LED Matrix driver chip - Imported the
tm1640module – this is the MicroPython driver that will provide us easy control over thetm1640LED matrix driver chip on the shield - Created a
tmobject that represents our LED Matrix driver. This took two parameters, the two pins that are used for communicating with thetm1640chip (a clock pin and a data in/out pin) - Wrote an 8-long list filled with 255’s to our
tmobject – this is what turns the LED Matrix LEDs on!
The format of the list that we wrote to the tm object is that each element
of the list represents a row, and each bit in that element represents one of
the LEDs in that row, with 1 being illuminated and 0 being off. As
255 == 0b11111111, and we wrote 255 to all 8 elements of the list, we
illuminated all 8 LEDs, on all 8 rows.
Our driver library also gives us access to a brightness() method on our
tm object, if we wanted to reduce the brightness of the LED matrix. This
takes a single argument of an integer from 0 to 7, where 0 is the minimum
brightness, and 7 is the maximum (this is the default). So if we wanted to
reduce brightness by a bit but not all the way we could do:
tm.brightness(3)
If you wanted to (slightly) improve visualisation of what you are writing to the matrix in your code, you could format it like so:
1 2 3 4 5 6 7 8 9 10 | tm.write([
0b00000000,
0b01100110,
0b01100110,
0b00000000,
0b00000000,
0b10000001,
0b01111110,
0b00000000,
])
|
Blue pill, red pill
Now that you know how to light up LEDs individually, it’s time to learn about some convenience functions that can help display text.
Let’s display a letter on the matrix:
tm1640.display_letter(tm, "X")
And, for the pièce de résistance:
tm1640.scroll_text(tm, "Scrolling for days...")
These are enabled by using a FrameBuffer, a module built-in to MicroPython that provides a general - and efficient! - way to draw onto an in-memory ‘canvas’.
Advanced: FrameBuffer
A flexible way to control the LEDs in the matrix is by using a MicroPython frame buffer. This is done like so:
1 2 3 4 5 6 7 8 9 10 11 12 13 14 15 16 17 | # Instantiate our 8x8 frame buffer
import framebuf # Bring in the frame buffer library
buf = bytearray(8) # Reserve 8 bytes of memory for the frame buffer
fb = framebuf.FrameBuffer(buf, 8, 8, framebuf.MONO_HMSB)
# Draw things into our frame buffer
fb.text('!', 0, 0, 1) # Draw an !
fb.hline(3, 7, 2, 1) # Supplement the bottom of the ! as the font is 7x7
fb.vline(0, 0, 8, 1) # Draw line down left side
fb.vline(7, 0, 8, 1) # Draw line down right side
fb.pixel(1, 0, 1) # Extend end of lines
fb.pixel(1, 7, 1)
fb.pixel(6, 0, 1)
fb.pixel(6, 7, 1)
# Draw the buffer of the frame buffer to the "display"
tm.write_hmsb(buf) # Note that this takes buf, not fb
|
By using this we have a powerful set of tools for drawing whatever we want to the matrix (including text) without knowing the specific set of bits corresponding to our image!
Exercises
Time to take those concepts and put them into action! The following subsections detail different exercises that can be accomplished using the techniques covered so far.
Exercise 1: Wake up, Neo
Implement a simple countdown timer.
Ask the user for a duration in seconds. Count down from that time, scrolling the number past until 0 is reached, then display an asterix and invert it every half second to indicate an alarm is occurring.
Extension: Also use the buzzer and button shields - beep with each passing second, buzz when 0 is reached and use the button to stop the alarm.
Exercise 2: Be still my beating heart
Display an image of a heart on the LED matrix.
Now, animate it, by displaying different sized hearts in rapid succession.
Extension: Use a buzzer shield (with a 2UP board) to beep in time with the heart.
Exercise 3: Lo-fi Charting
Render a simple chart.
Use the following data:
data = [100, 130, 160, 160, 250, 180, 150, 100]
Scale it appropriately (so the maximum data is display with the topmost LED).
Extension: Provide an option to fill all the LEDs below (more like a bar chart).